
This post is based on the question in sp-dev-docs repo.
The question is how can we render a Google Charts in SPFx web part.
Actually, it's pretty easy thing to do.
As a starting point I'll be using the code provided in the question I mentioned above:
<script type="text/javascript" src="https://www.gstatic.com/charts/loader.js"></script>
<script type="text/javascript">
google.charts.load("current", {packages:["corechart"]});
google.charts.setOnLoadCallback(drawChart);
function drawChart() {
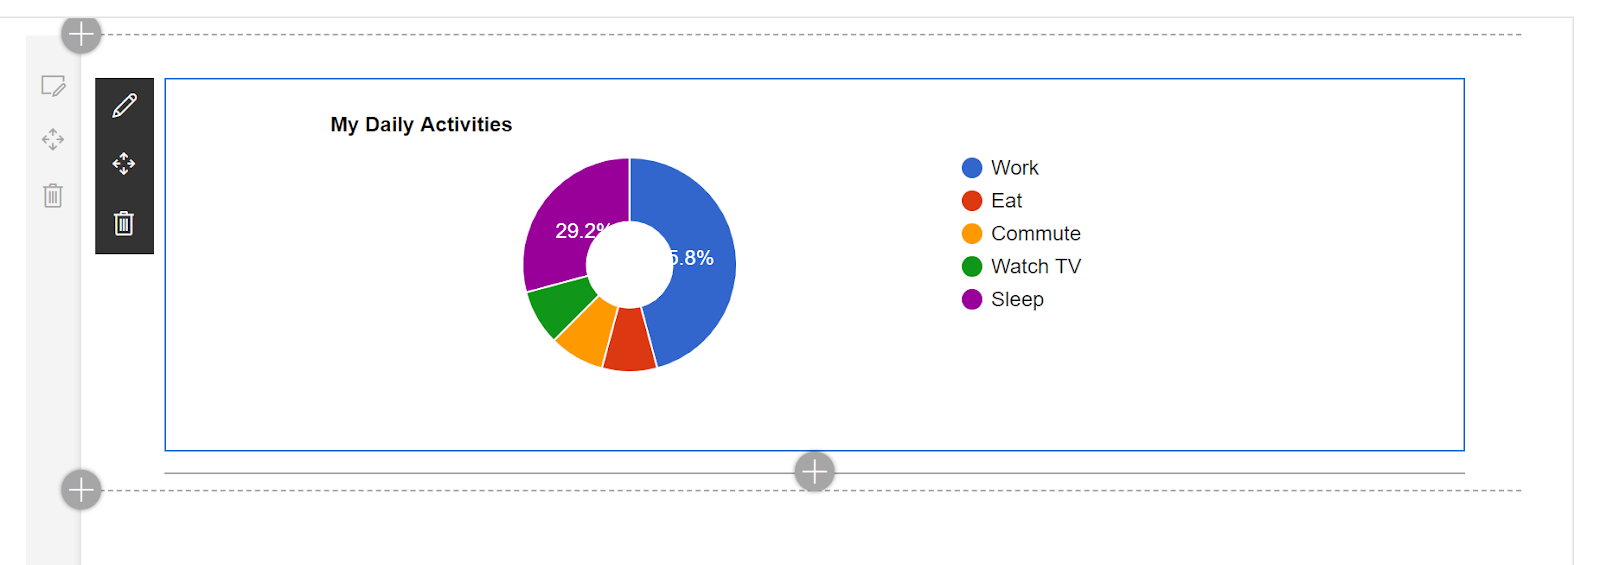
var data = google.visualization.arrayToDataTable([ ['Task', 'Hours per Day'], ['Work', 11], ['Eat', 2], ['Commute', 2], ['Watch TV', 2], ['Sleep', 7] ]);
var options = {
title: 'My Daily Activities',
pieHole: 0.4,
};
var chart = new google.visualization.PieChart(document.getElementById('donutchart'));
chart.draw(data, options);
}
</script>So, we need to
- Reference loader script from external CDN
- Use that loader to load additional scripts for charts
- Render a chart after all dependent scripts are loaded
Google Charts loader is a non-AMD script. So, we need to proceed with steps from official documentation on how to load a non-AMD module.
First, let's update config/config.json to reference external script with global namespace google:
"externals": {
  "google": {
    "path": "https://www.gstatic.com/charts/loader.js",
    "globalName": "google"
  }
}For the simplicity I've just added 2 properties into declaration: charts and visualization.
declare module "google" {
    interface IGoogle {
        charts: any;
        visualization: any;
    }

    var google: IGoogle;
    export = google;
}import * as google from 'google';Next, let's modify web part's render method to remove all unnecessary HTML and leave there a single div with pre-defined id that will be used later to render a chart:
public render(): void {
  this.domElement.innerHTML = `
    <div class="${ styles.helloWorld}" id="pie-chart">
    </div<`;
}private _drawChart() {
const data = google.visualization.arrayToDataTable([
['Task', 'Hours per Day'],
['Work', 11],
['Eat', 2],
['Commute', 2],
['Watch TV', 2],
['Sleep', 7] ]);
const options = {
title: 'My Daily Activities',
pieHole: 0.4,
};
const chart = new google.visualization.PieChart(document.getElementById('pie-chart'));
chart.draw(data, options);
}protected onInit(): Promise<void> {
google.charts.load("current", { packages: ["corechart"] });
google.charts.setOnLoadCallback(this._drawChart.bind(this));
return super.onInit();
}
And that's it! Google Charts are added to the SharePoint Framework web part!
You can find the code for this sample here.
I want to mention that this sample is not final solution to be reused without modifications as it doesn't contain some additional must-haves like checking in _drawChart if pie-chart div has been added to the DOM and so on. So, think of it as a starting point for your implementation.
That's it for today!
Have fun!
Comments